

Ad Museum Tokyo
Web App, 2001
WHAT: A reference tool to explore the database of ad giant Dentsu’s historical ad content.
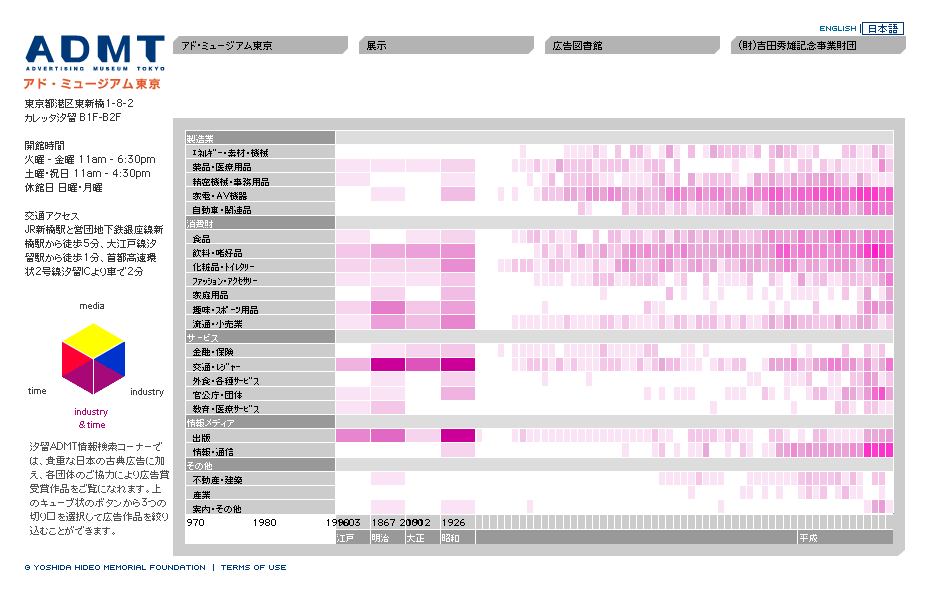
HOW: The user selects an combination of industry & time, or media & industry, or media & time, and a grid shows the volume of content at each intersection.
WHY: The client asked for an interesting way to browse their vast library of content.
WHO: For the employees of Dentsu.

Development
The Tokyo Museum of Advertising had an enormous database of historical ad content. How do you organize such a large breadth of advertising?
I proposed a method of arranging all the content by industry, media and time, and allowing the user to choose two axes to display the results.
The color of the cell indicates the number of ads found at that intersection. Clicking that cell brings up the thumbnails of all those ads in that category. An embedded media player then presents the ad.


Me visiting the Ad Museum in 2019